Microscopy Techniques for Batteries & Energy Storage Research
Round-up of tools for your new or existing electron microscope, for studying materials and cell chemistry in energy storage research. With these analytical techniques you can enhance your TEM or SEM for studying power/energy density, coulombic efficiency, battery life cycles and more. All of these can be added to your microscope using systems from Gatan.
Blue Scientific is the official Nordic distributor of systems from Gatan in Norway, Sweden, Denmark, Iceland and Finland. If you have any questions or if you’d like a quote, please get in touch:
Gatan Instruments
Contact us on 01223 422 269 or info@blue-scientific.com
Analysing Battery Performance
The effectiveness and efficiency of batteries and fuel cells is affected by the diffusion of ions, electron transport, the structure and chemical dynamics of electrode/electrolyte materials and electrochemical processes eg cycling. With these microscopy techniques, you can examine the structure–property relationship of each component and its behaviour during electrochemical processes. This may involve changes in ion relocation, lattice expansion/contraction, phase transition or structure/surface reconstruction:
- Measure material composition and uniformity
- Determine grain boundary losses and activity
- Defect analysis
- Factors reducing current
- Measure contamination
- Analyse chemical phases
Techniques
These techniques for SEM/TEM can help you understand the relationship between the microstructure, defects and optical properties of energy storage materials. All of these capabilities can be added to your new or existing electron microscope with instruments from Gatan:
- Cathodoluminescence (CL)
Examine the chemical and electronic properties of materials at microscopic level. - Electron-beam induced current (EBIC)
Characterise the electrical properties of materials and devices at microscopic level. - Electron energy loss spectroscopy (EELS)
Atomic resolution chemical and compositional analysis. - Energy-filtered transmission electron microscopy (EFTEM)
Enhance, map and quantify elements and chemicals in an image with nanometer resolution. - Spectrum imaging
Spatially resolved distribution mapping, using EELS data. - TEM cameras
Enhance your microscope with a new camera, for higher resolution, more powerful imaging to help you to understand material growth, failures and the ultra-structure of devices. - In-situ
Observe growth processes in real time, as well as chemical reactions, oxidation, irradiation effects, mechanical, magnetic and ferroelectric properties. - Sample preparation
Cut, etch, polish and freeze samples to get the best results. - Energy dispersive X-ray spectroscopy (EDS/EDX)
Elemental and chemical characterisation. - Electron backscatter diffraction (EBSD)
Study the crystallographic orientation and texture of materials.
View the complete Gatan range…
[hr]Examples
Composition Uniformity
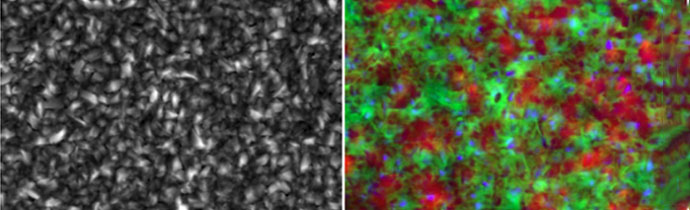
With cathodoluminescence, you can distinguish variations in material composition between grains. In the example below, variations are highlighted by colour. The excess of vacancy point defects at grain boundaries is shown in blue:
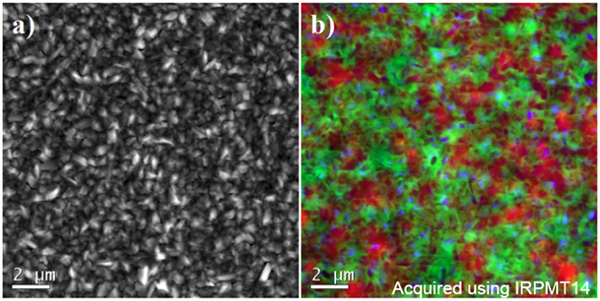
a) Secondary electron image of Cu0.8In0.2AgSe2 film.
b) Overlaid monochromatic cathodoluminescence images: 1.181 eV emission (blue), 1.121 eV (green), 1.033 eV (red). Courtesy of A.R. Aquino Gonzales, University of Illinois.
Grain Boundaries
Reveal unique grain boundaries that may not otherwise be visible or clear, by imaging the same sample with different techniques. This example uses panchromatic cathodoluminescence:
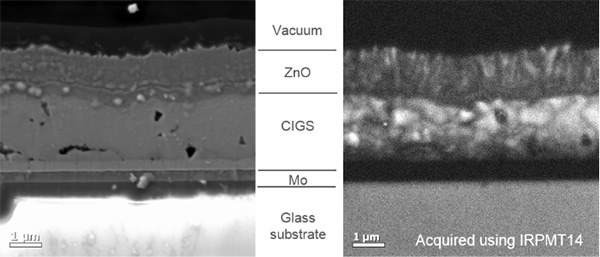
Left: Secondary electron image.
Right: Panchromatic cathodoluminescence image.
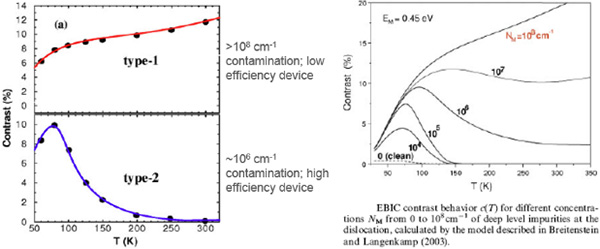
Quantify Contamination
Quantitatively characterise electrical properties with SmartEBIC. The data on the left is from a SEM SmartEBIC experiment, together with the theory underlying the efficiency analysis:
Chemical Phase Analysis
Samples that are too beam sensitive for STEM probes can be analysed with EFTEM. In this example, a LiFePO4 battery was half reduced and then sliced for analysis. During reduction LiFePO4 is reduced to FePO4:
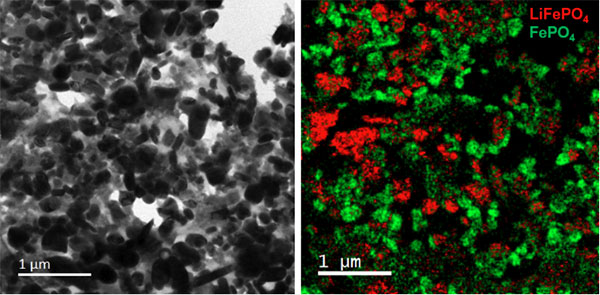
LiFePO4 battery. Left: CTEM image. Right: EFTEM SI.
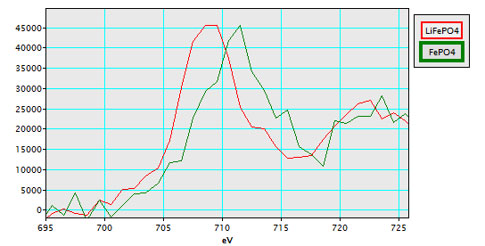
There is a shift in the L3 line position. The oxidation state in LiFePO4 is Fe2+, and Fe3+ in FePO4. A spectra was acquired from each particle used as a reference for a multiple linear least squares (MLLS) fitting routine. This reveals a chemical shift of approximately 2 eV, which can then be mapped with EELS:
Further Information
This list of applications is not exhaustive, so please contact us if your area of work is not mentioned. We’re available to advise on the best tools to get you the results you need, so please contact us if you have any queries:
Contact us on +44 (0)1223 422 269 or info@blue-scientific.com
Gatan Instruments

Gatan Vulcan cathodoluminescence detector for electron microscopes.