Studying Crystal Orientation in Geology with Cathodoluminescence Polarisation-Filtered Spectrum Imaging
SEM-based cathodoluminescence can be used to study crystal structure orientation – in this example we look at how it can be used on a geological sample.
Cathodoluminescence in Geology
Cathodoluminescence microscopy (also known as CL) can be used to determine the structures, compositions and history of various geological samples. By analysing mineral thin sections, spatial and/or spectral variations in the luminescence signal show the distribution of trace elements. This provides insights into its geological history.
Studying Polarisation
Polarisation studies are a key part of mineral thin section analysis with optical microscopy. However, the polarisation state of the CL signal is often ignored, because of a lack of suitable analytical tools.
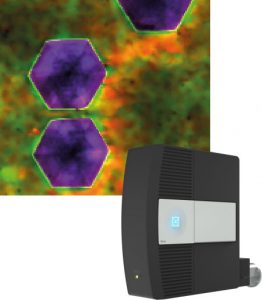
The Gatan Monarc Pro is a SEM-based system that analyses cathodoluminescence emissions. With automated features and recipe-driven workflows, it makes it easier to capture high quality data, even if you’re less experienced with CL.
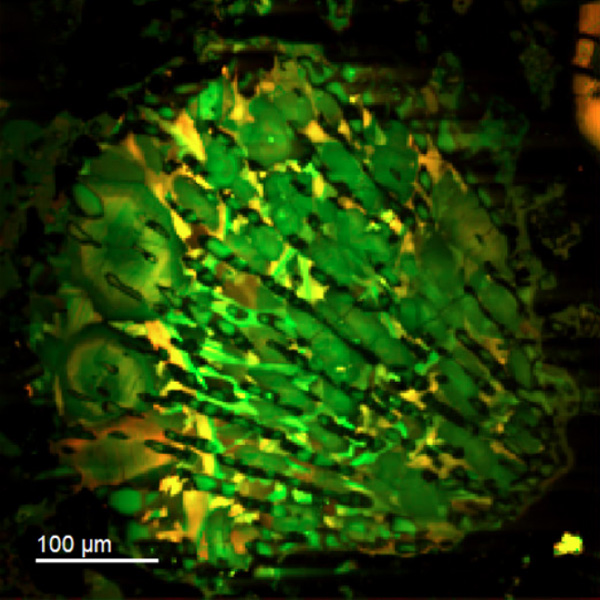
In the following example, the degree of polarisation and polarisation direction are measured in a chondritic meteorite sample to determine crystal orientations.
Example: Chondritic Meteorite
The chondritic meteorite specimen was from Miller region 090010.
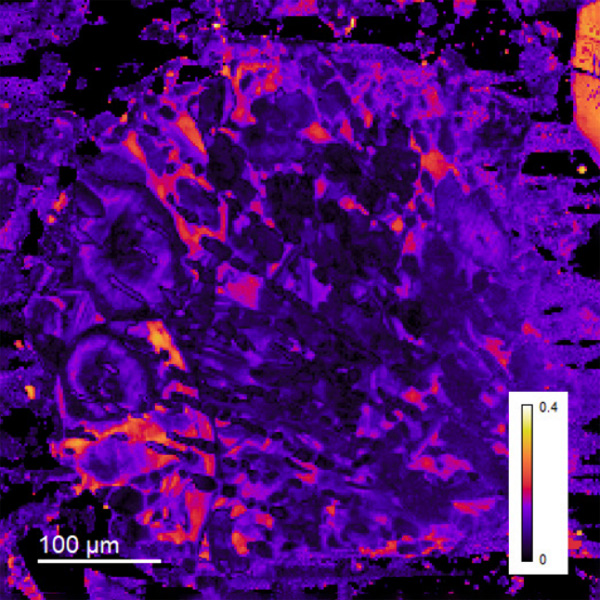
This experiment shows how the degree of polarisation and polarisation direction maps can be collected from a geological sample using the Gatan Monarc Pro. The crystals serve as the first polariser in the polarisation analysis, and the resulting maps reveal their orientation.
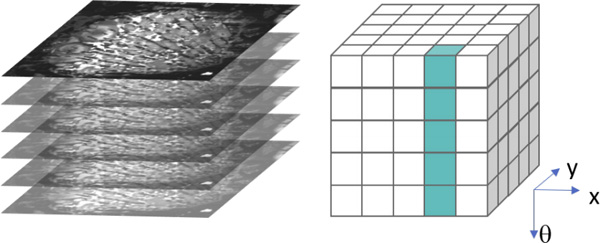
First a polarisation spectrum image was captured. This consists of an aligned stack of polarisation-filtered CL images. It was acquired using a rotatable, broadband linear polarisation filter and Gatan’s MultiMap feature, part of their DigitalMicrograph software.
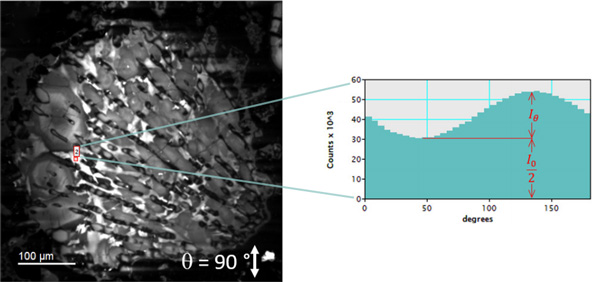
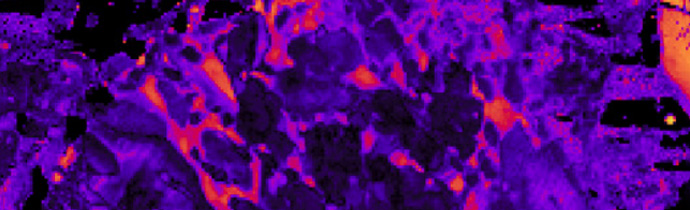
Maps of the degree of polarisation, the polarisation angle and the unpolarised component were extracted by fitting using the Law of Malus at each pixel in the data cube. The sample was assumed to be the first polariser, and the Monarc’s rotatable polariser angle was extracted from the polarisation spectrum image.
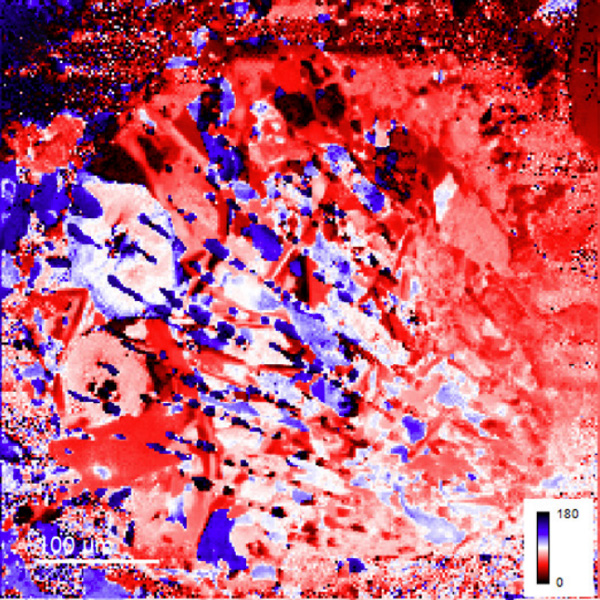
These results demonstrate how crystal orientation can be determined using using SEM-based cathodoluminescence. This could also be used to analyse the birefringence of a specimen.
Full details of this experiment are available in a pdf application note from Gatan.
Gatan Monarc Pro
- Complete analysis of CL emissions.
- All users can acquire high quality data, whatever their experience level.
- Unprecedented sensitivity, for the highest quality spectra and images in the shortest time.
- Accurate correlation: signals for morphology and composition matching are detected simultaneously.
More Information
Blue Scientific is the official distributor of Gatan systems for electron microscopes in the Nordic region (Denmark, Sweden, Finland, Norway and Iceland). We’re available to answer all your questions – just get in touch: