Characterising Glass Fibre-Reinforced Polymers and Composite Materials with SEM-EDS
SEM-EDS can be used to characterise the composition of polymer composites. This is useful in failure analysis, to detect and identify contaminants and defects, and to check homogeneity in composite materials.
The Thermo Scientific Axia ChemiSEM collects SEM and EDS data simultaneously, making it quicker and easier than conventional SEM-EDS.
Blue Scientific is the official distributor for Thermo Scientific Axia ChemiSEM in the UK and Ireland. For more information or quotes, please get in touch.
SEM-EDS instrumentation
PDF application note
Contact us on +44 (0)1223 422 269 or info@blue-scientific.com
Characterise Composite Materials
SEM-EDS can be used to characterise the composition of polymer composites. This is useful in a variety of industries where materials are added to polymers for reinforcement or enhance their properties, including electronics, automotives and the marine industry.
Glass Fibre-Reinforced Polymers
Glass fibre-reinforced polymers (GFRPs) are composite materials consisting of polymer matrices mixed with one or more types of glass fibre. This combines the strength and stiffness of the glass fibres with the elasticity, light weight and durability of the polymers. Each type of fibre has unique properties for specific benefits – for example electrical insulation, thermal/chemical resistance or tensile strength.
Failure Analysis and Quality Control
The efficacy of these properties can be affected by contamination, which can occur during manufacturing or if the material’s used in unintended environments. This can lead to degraded product performance, compromised electrical insulation, mechanical failure or reduced chemical resistance.
By characterising composite materials with SEM-EDS, these problems can be avoided:
- Identify contaminants
- Assess their distribution
- Evaluate homogeneity of fibre dispersion
SEM-EDS is a useful tool in failure analysis and process control. By identifying sources of contaminants the manufacturing and handling processes can be optimised to avoid these problems in future.
SEM-EDS
SEM-EDS is Scanning Electron Microscopy with Energy Dispersive X-ray Spectroscopy.
- SEM provides grayscale topographic images.
- EDS maps elemental composition.
Traditionally this was a rather slow process, involving switching between two different systems and separate PCs. However, with the new Axia ChemiSEM from Thermo Scientific, the two methods are fully integrated in one easy-to-use system and data is acquired simultaneously. Results are highly visual and displayed in colour, making it easy to spot defects and contamination.
Benefits of SEM-EDS
- Continuous analysis – Elemental information from EDS is available all the time.
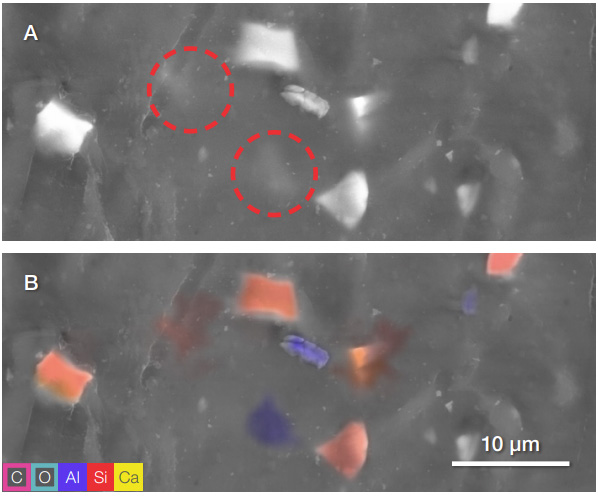
- Easy to interpret – Defects and contaminants are much more visible in colour than on a greyscale SEM image.
- Fast results – No need to switch between interfaces as elemental information is displayed directly on the SEM image.
- Less preparation – Non-conductive materials can be analysed without coatings in low-vacuum mode.
Spot Defects and Contaminants Easily
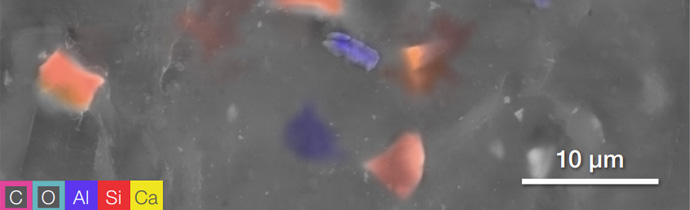
Specific elements of interest can be selected to eliminate irrelevant information. In the example below, carbon and oxygen have been deselected to make the features of interest clearer.
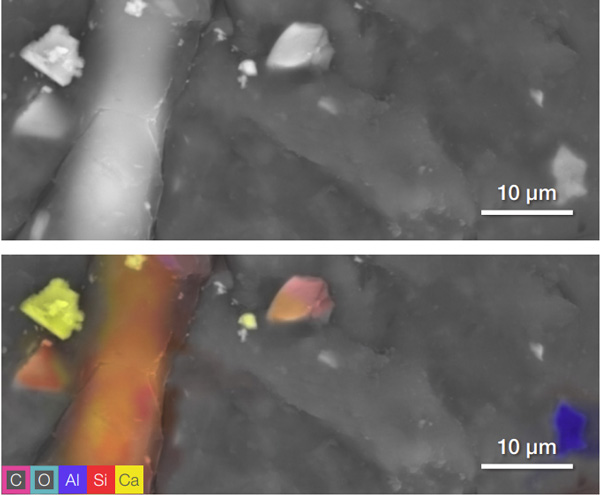
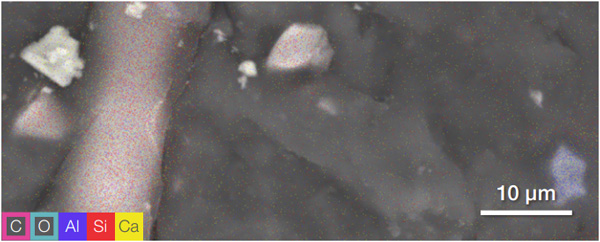
As a comparison, the traditional gross counts map below was acquired in the same length of time as the ColourSEM image above (40 seconds). It shows how much more vivid the ColourSEM image is, providing clearer chemical information than the sparse data points from conventional EDS collection.
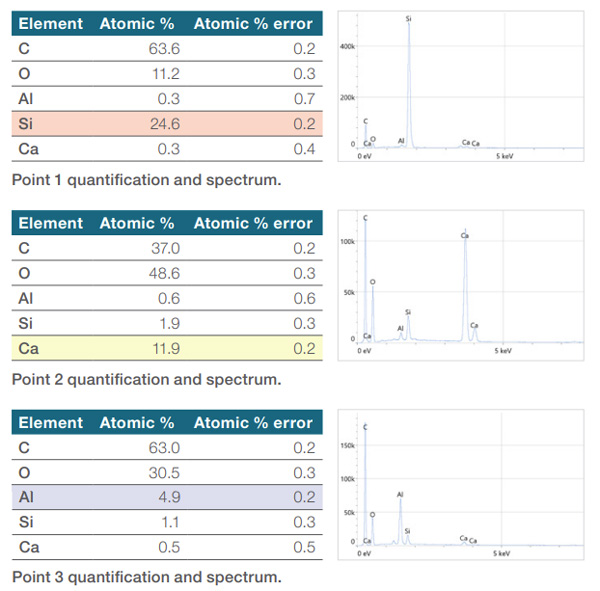
Point Analysis
Once the particles or areas of interest have been located, point and ID analysis provides more information to suggest their possible source and root cause.
The tables below show the quantification of three points, with the most abundant element highlighted. Part of the C and O signal is likely due to the polymer matrix.
Point 1 can be identified as silicon. For point 2, there are small peaks of silicon and aluminum, possibly coming from the neighbouring glass fibre. Point 3 shows that of the three elements of interest (Al, Si, Ca), Si is the most abundant, confirming a different nature than the two points previously analyzed. At point 3, C and O are the most abundant detected elements because the particle is smaller than the other two, so part of the signal comes from the surrounding area or the polymer matrix below the particle.
Full details of this example are available in Thermo Scientific’s PDF application note.
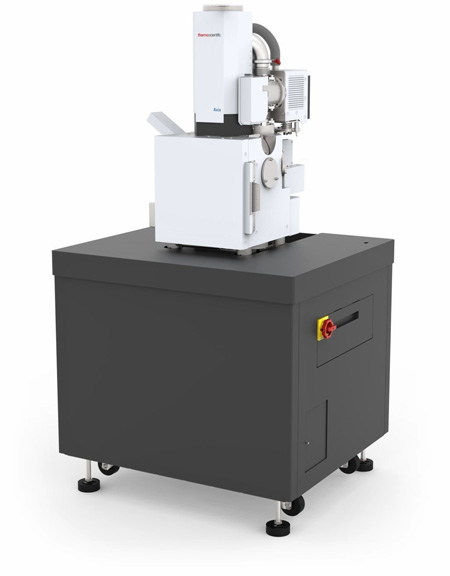
Thermo Scientific Axia ChemiSEM
- Continuous EDS for quantitative elemental information at any time.
- Designed to make SEM easier to use.
- Automated features for convenience.
- Acquire data twice as fast as alternative SEM-EDS systems.
- Large chamber for samples up to 10kg.
More Information
Blue Scientific is the official distributor of the Thermo Scientificc Axia ChemiSEM in the UK and Ireland. We’re available to answer all your questions – just get in touch: